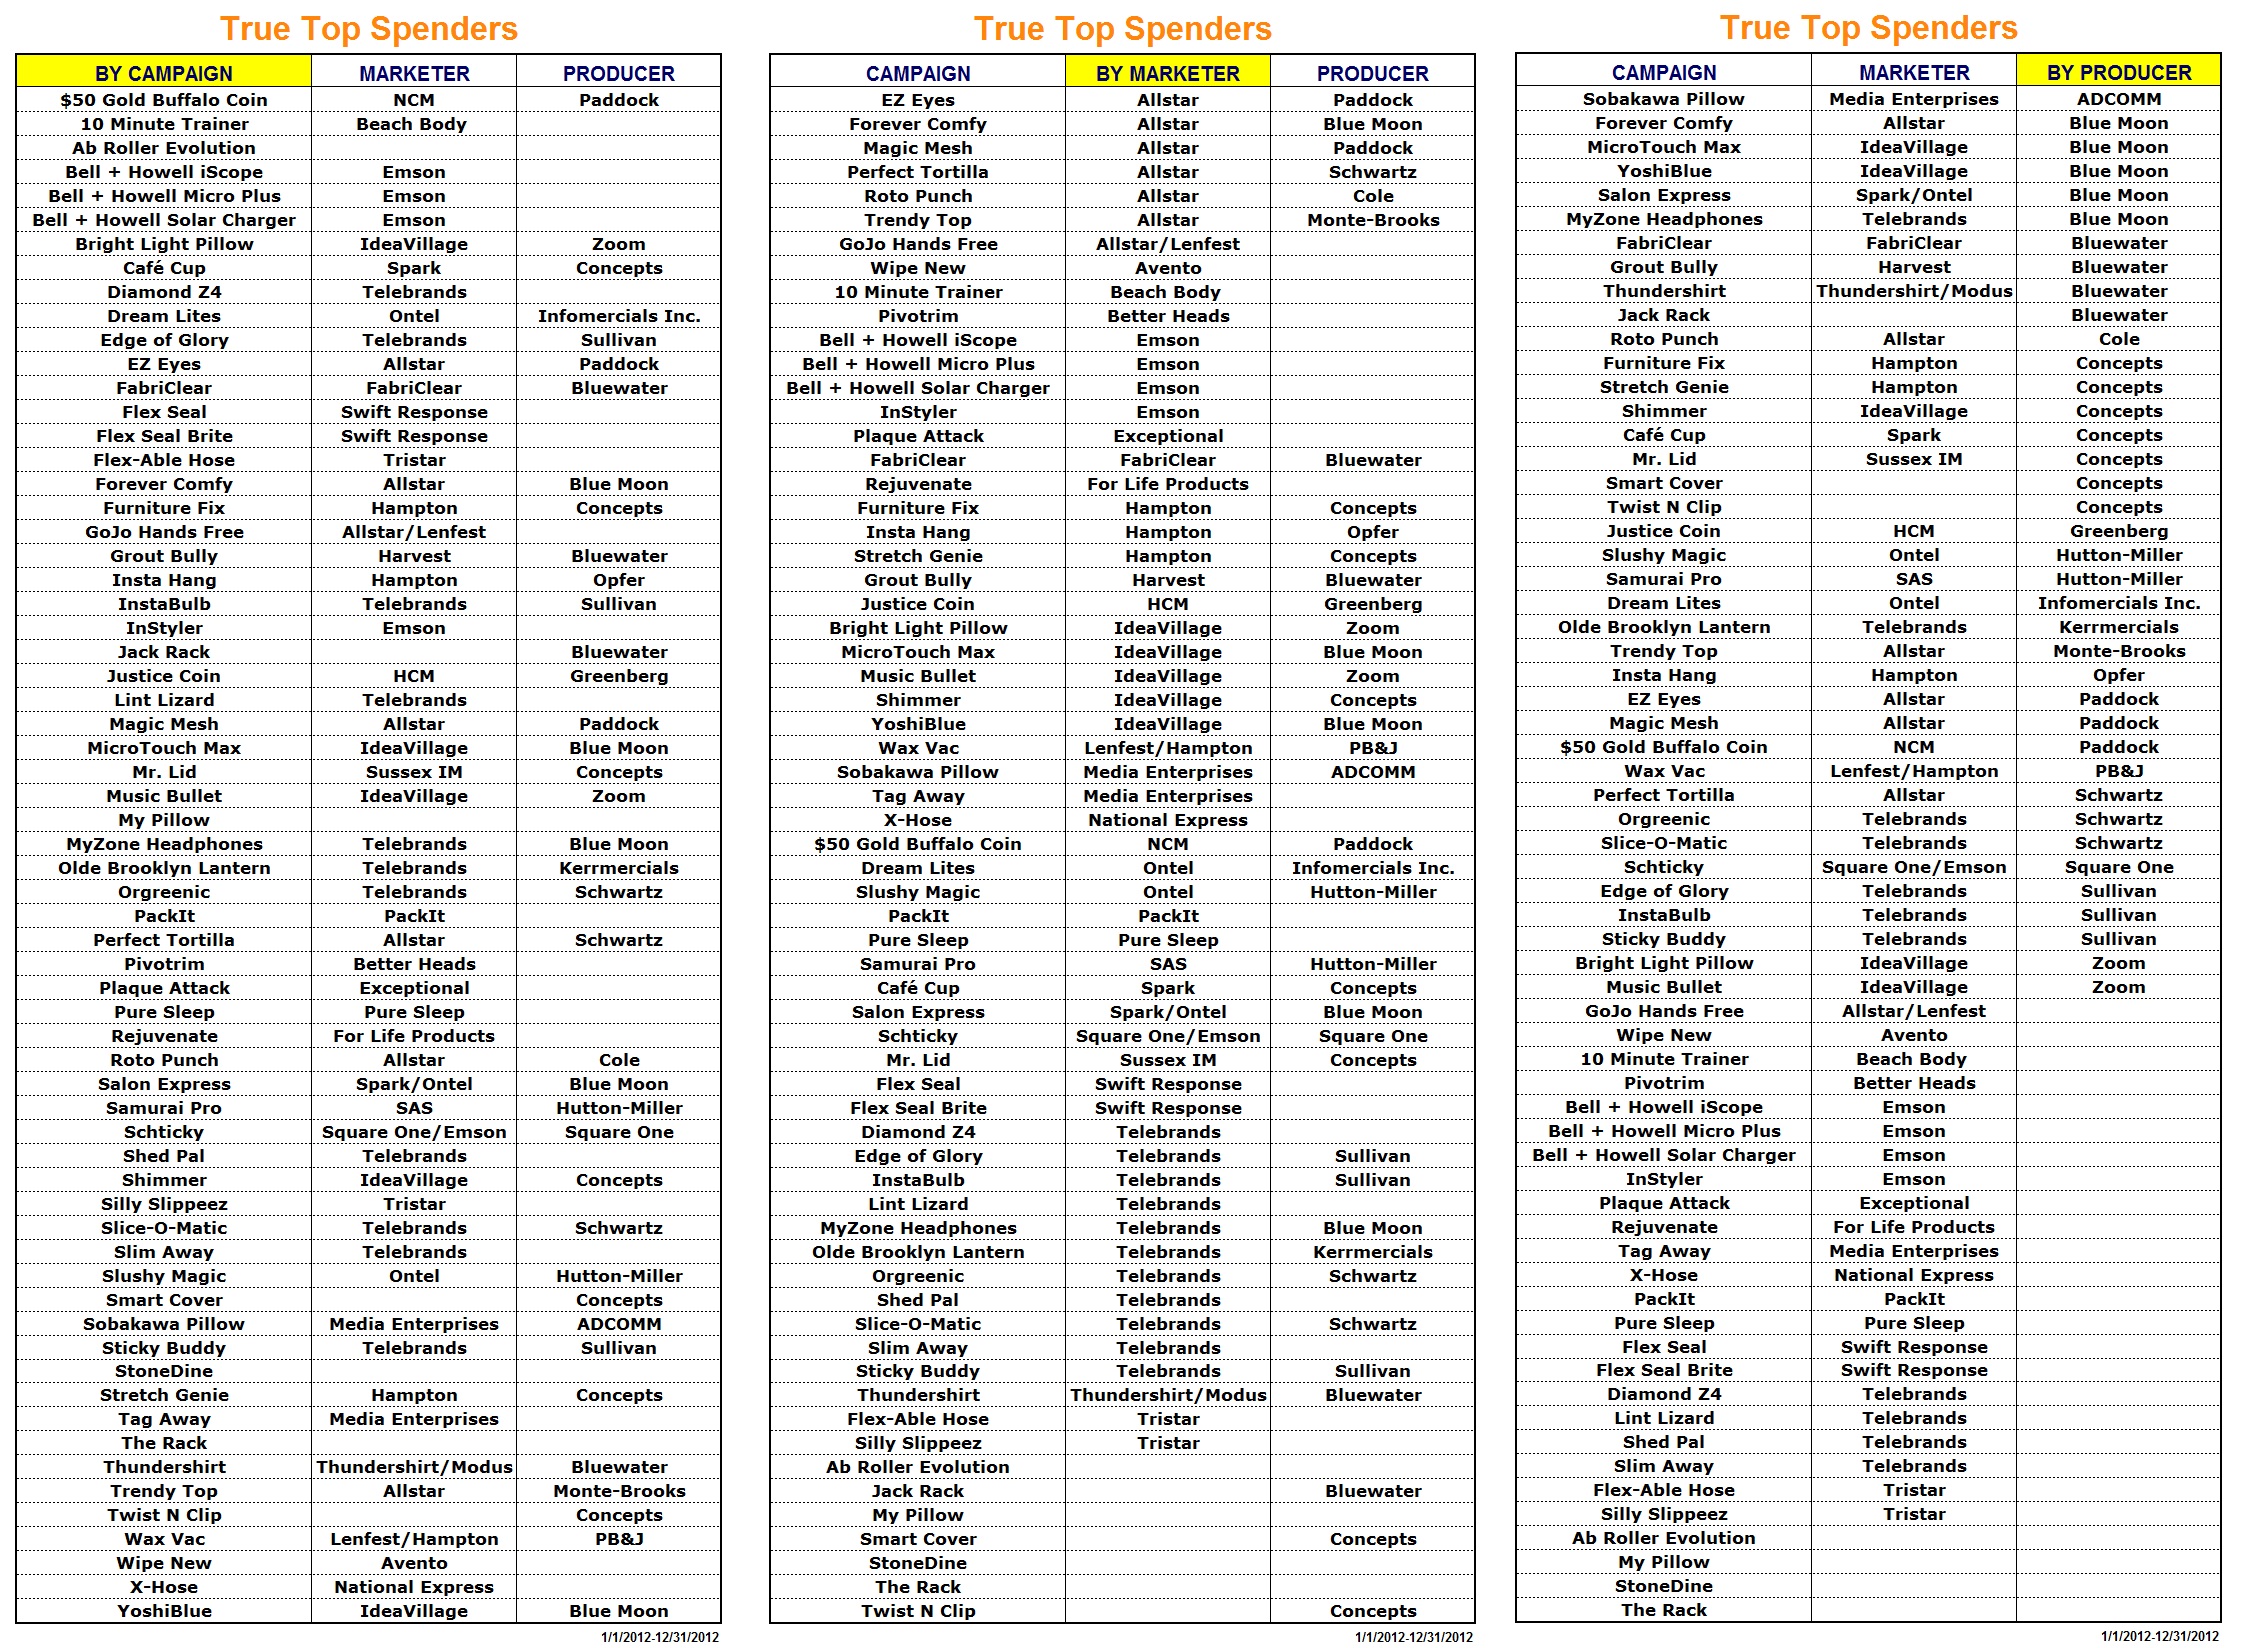
The peer review period is over, so without further ado: Here are the True Top Spenders for 2012 ... and the winners!
And now -- just in time for Housewares -- here is your True Top Marketer and True Top Producer ...
True Top Marketer: Telebrands Corporation!
Telebrands takes the top spot with ELEVEN rollouts on the list, a new record. They picked a great time to have one of their best years ever, too, as they are now celebrating 30 years in the business.
Meanwhile, Allstar dropped to second place with seven roll-outs, down from 10 at mid-year. But this is largely an artifact of some strong campaigns from the previous year (Sift & Toss, Perfect Meatloaf, Forever Lazy) coming to their natural end. After that, it's IdeaVillage with five full rollouts for the year and Emson with four, three of them under the Bell + Howell brand.
True Top Producer: Concepts TV!
Concepts remains atop the list with SEVEN roll-outs for the year. Just about the time one of the seven from mid-year came to its natural end (Sift & Toss), they hit with an even bigger winner (Spark Innovator's Cafe Cup). Congratulations to them! If the company doesn't have 30 years in business, it's close. And so 2012 was the year that proves DRTV companies improve with age, like a fine wine.
Meanwhile, Blue Moon Studios takes second place and appears to be on the rise, already gunning for the top spot in 2013 with a solid hit (Forever Comfy). After that, in third, it's a tie between Bluewater (FabriClear, Grout Bully, Thundershirt, Jack Rack) and Paddock Productions ($50 Gold Buffalo Coin, Magic Mesh, EZ Eyes, Olde Brooklyn Lantern).
Now, some housekeeping. Astute readers will notice the list has changed slightly from before. This is because of a robust peer review process (thank you, everyone) that revealed a flaw in the system: the ranking. I was able to look at the actual DR spending for some campaigns and compare it to what the third-party reporting services estimate. In some cases, the estimates were dead on. In other cases, the estimates were double or triple. I always figured the estimates were based on rate card and would be consistently high. But I was wrong. It seems the media mix of a campaign matters because DR players get significantly discounted rates on some networks and close to normal rates on others.
So does that undermine my list? No. In fact, my next realization was that ranking doesn't matter. The purpose of this list has always been to separate the truth from the BS. My intention is simply to know (and share) whether a marketer actually spent rollout dollars on a campaign (the best way I have of gauging a winner from the outside) or if the ever-present hype is unsupported. By establishing an arbitrary cutoff of an average of $50,000 per week, which in most cases will be at inflated estimations, I believe I am capturing every campaign that spent enough to qualify as a real rollout. Whether that campaign spent a billion or a few million is not important for my purposes, and so relative rank is not important. I pick my winners based on the number of rollouts alone, not the rank of the rollouts.
And so, going forward, I have eliminated the rank column and will simply present my readers with an alphabetized list. In fact, to make the end result even more informative, when you click on the list atop this post you will get that list alphabetized three ways: by campaign, by marketer and by producer. That way, you can quickly assess who's hot -- and who's not.
Otherwise, my methodology remains unchanged. I only count 120s. I use calendar date ranges (first six months, full calendar year). And I eliminate campaigns that are beyond the focus of this blog (branding, long-form support, supplements, topicals, etc.) But I am always open for suggestions on how to improve this list. If you have a good one, feel free to shoot me an email or post your critique in the comments section of this post.
Coming soon ... I face the music and reveal my 2012 track record!